









Skip to content
Munavar Sahad — Digital Business Architect
Platforms/Report Automation

Reporting platform

Monthly Report Automation Platform

One automated report, pulled from every platform, ready every month.

An automated reporting system that pulls a business's marketing and sales data from every platform into one place — then produces a clean, presentation-style monthly report, so the owner or team no longer builds reports by hand in spreadsheets and slides.

Interactive demo for a fictional footwear & gear store. All names, products and numbers are invented.

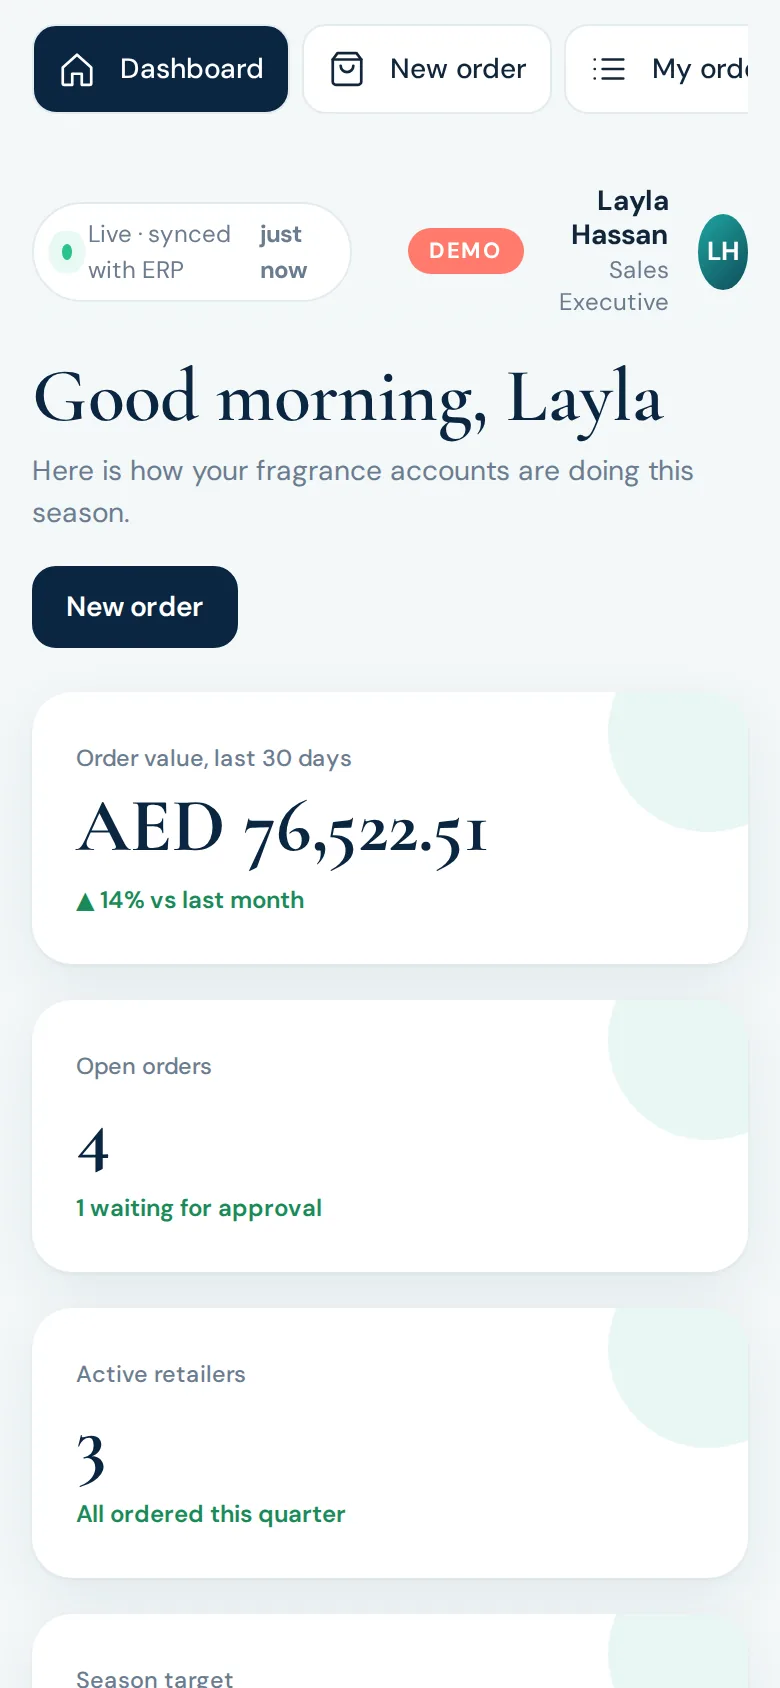
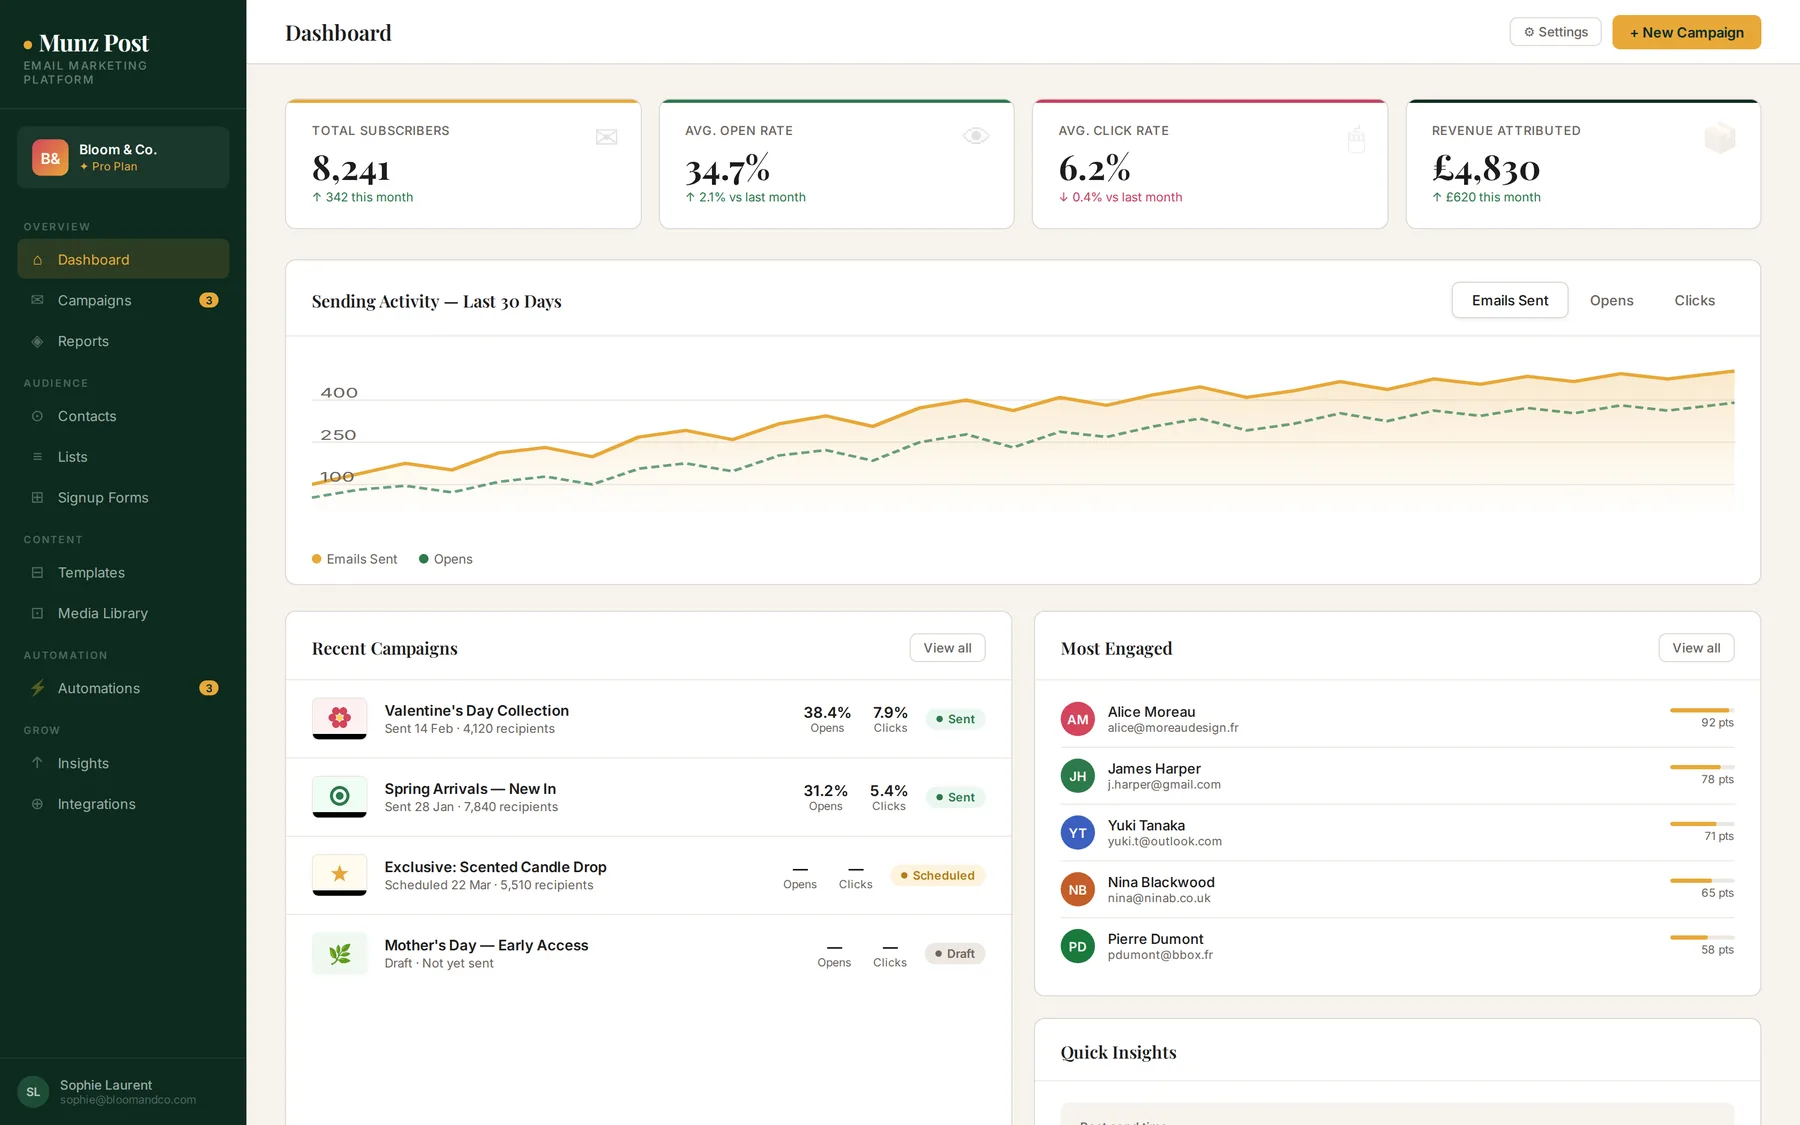
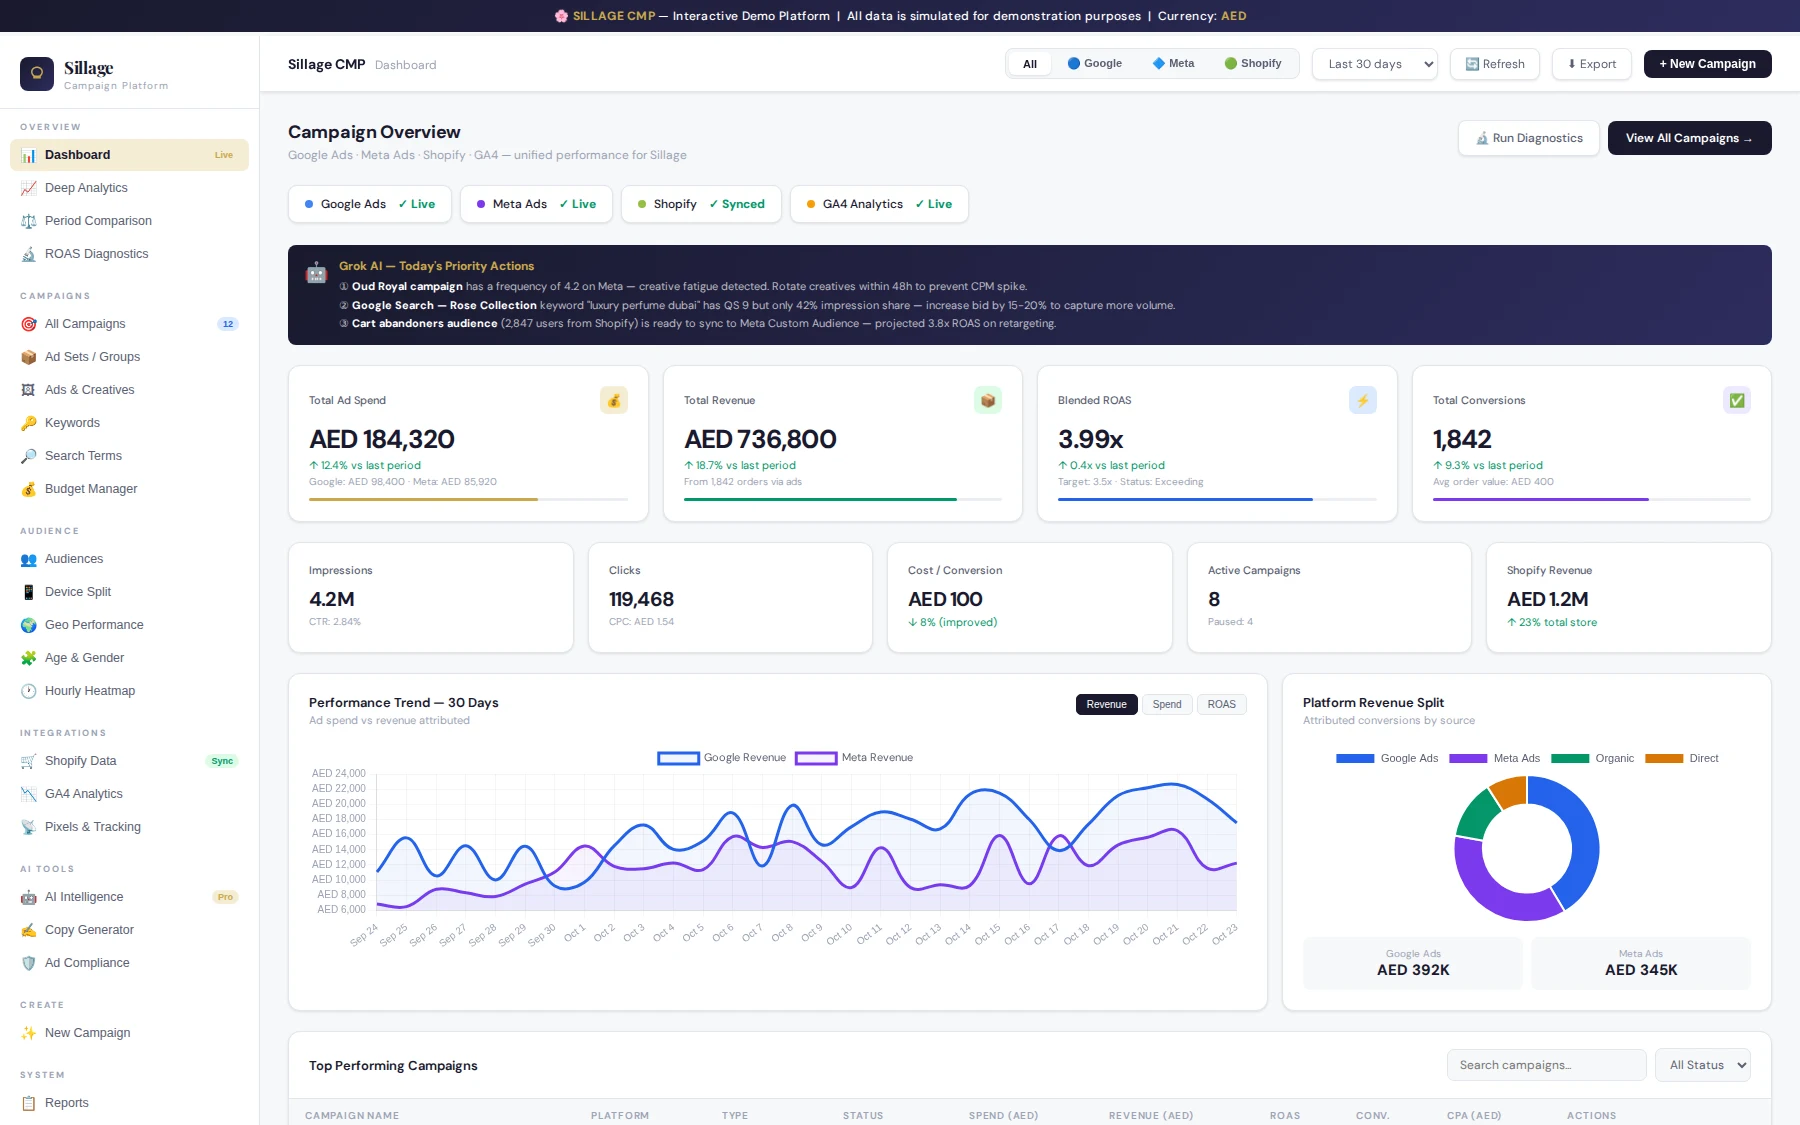
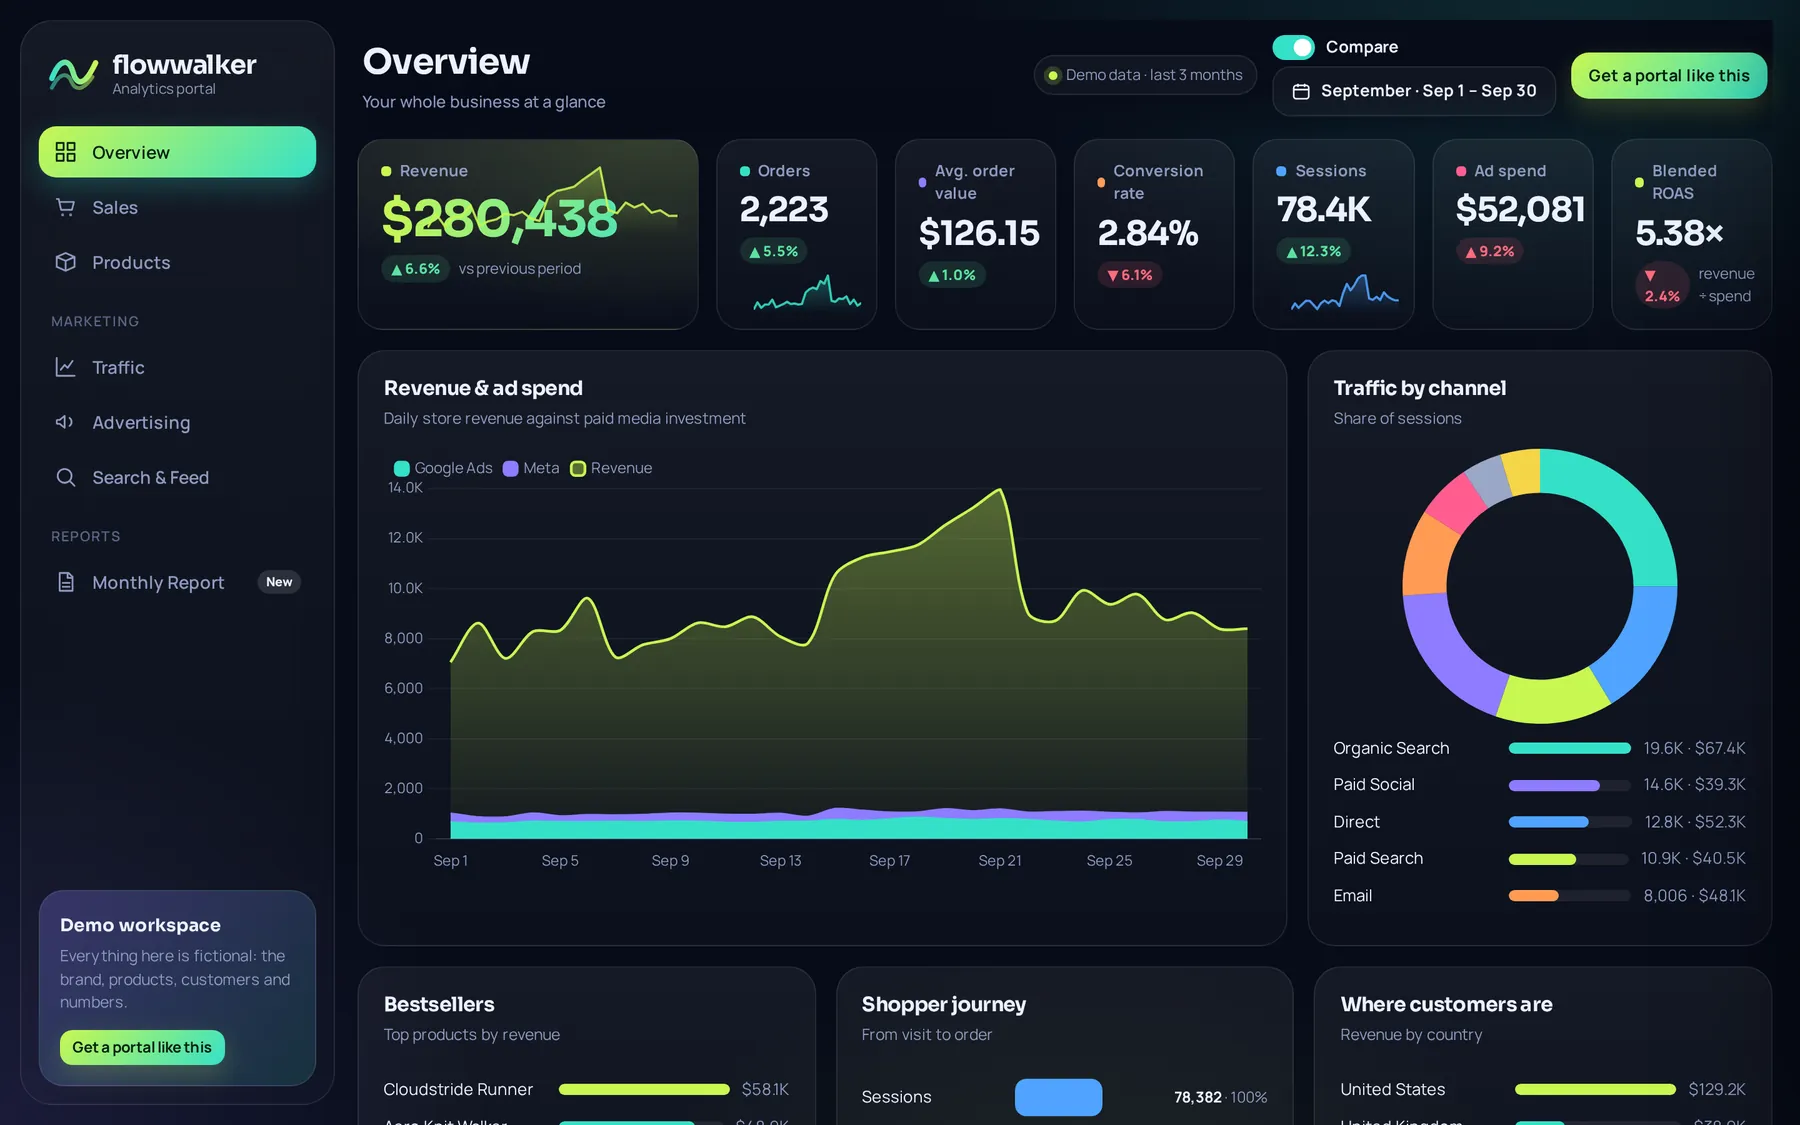
Monthly report automation dashboard showing revenue, orders, ad spend and traffic by channel
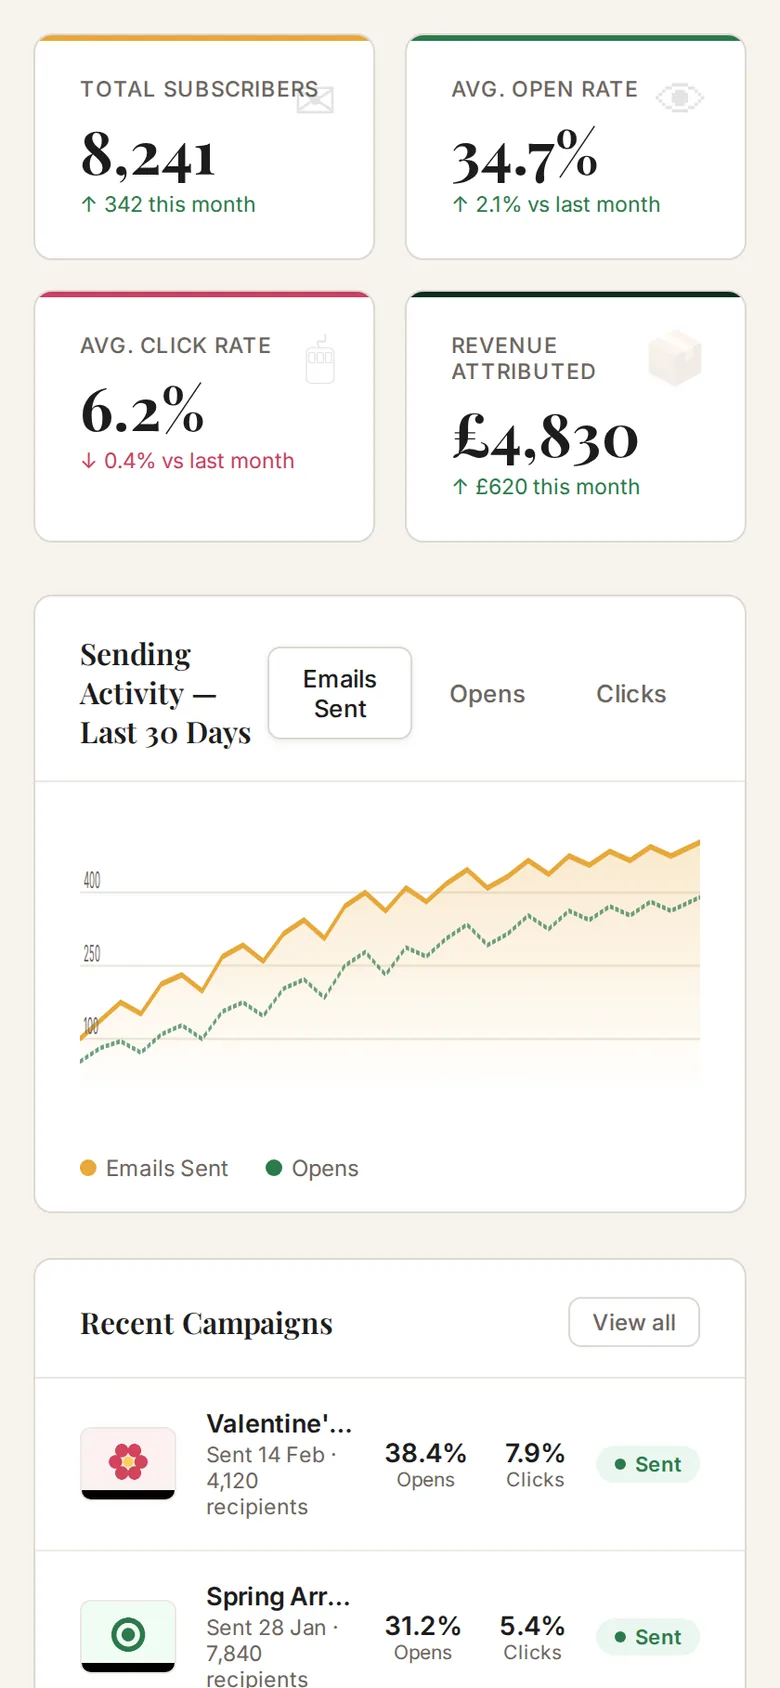
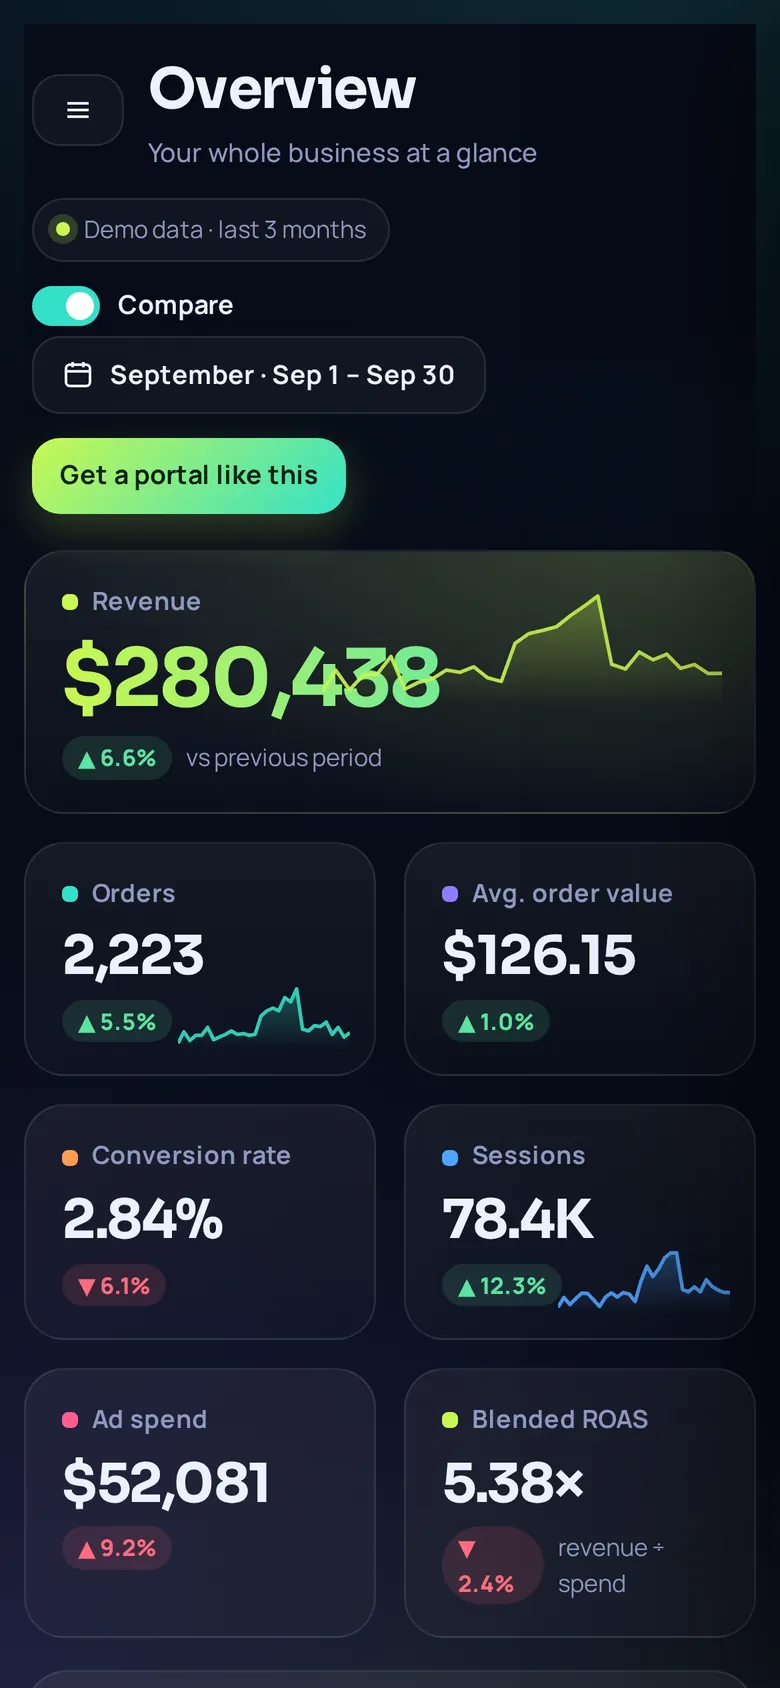
The reporting dashboard on a phone screen
Live demo · sample data
  • Read-only access
  • Daily data refresh
  • Slides + one-click PDF
  • Your brand, your hosting

The problem

What this replaces.

Reports take hours of copying numbers from many platforms.

Each platform reports different numbers, so nobody knows which to trust.

Data is stale by the time the report is ready.

Reports look different every month and rarely explain what to do next.

The walkthrough

See it, screen by screen.

Every screen below is a real frame from the interactive demo. Click any screenshot to enlarge it — or skip the reading and use the demo itself.

01 · Overview

One live dashboard for the whole business.

Revenue, orders, traffic, ad spend and search visibility sit in one view — with a date calendar and a comparison to the previous period, so a change is obvious the moment you open it.

02 · Products

Products, with their pictures.

See what sells, what is rising and what is running low. Every product shows its photo, revenue and units — and opens into its own page.

03 · Traffic

Traffic you can slice.

Filter by channel, source, medium and campaign to see where visitors come from and what they do next — from first visit to checkout.

04 · Advertising

Ad numbers, cross-checked.

Ad-platform numbers sit beside analytics and store numbers, so the real return on ad spend is clear — not just what one platform claims about itself.

05 · Search & feed

Search visibility and feed health.

Clicks, impressions, average position and the queries behind them — together with the health of the product feed, so a disapproved product never goes unnoticed.

06 · The report

The monthly report builds itself.

A branded slide deck covering revenue and orders, brand and product performance with product photos, traffic and funnel, channels, best days and hours, and ad performance — created from the same data, with no copying and pasting.

07 · Present & export

Present it, or send it.

Open the report full-screen to present it in the meeting, or export it to PDF in one click to send or archive.

08 · Insights

Insights in plain language.

Each report ends with notes on what changed and what to check next — specific, ranked, and written so an owner can act on them.

What this includes

Everything in the platform.

One Live Dashboard

Sales, website traffic, ad spend, search visibility and product-feed health in one place, with a date calendar and comparison to the previous period.

Cross-Platform Analysis

Ad-platform numbers shown beside analytics and store numbers, so the real return on ad spend is clear — not just what one platform claims on its own.

Source Filtering

Filter traffic analysis by channel, source, medium and campaign to see exactly where performance is coming from.

Automatic Monthly Report

A branded slide deck covering revenue and orders, brand and product performance with product photos, traffic and funnel, channels and links, best days and hours, ad performance, and per-brand analysis.

Presenting Mode & PDF Export

Full-screen presenting mode for the report, plus one-click PDF export for sending or archiving.

Automatic Insights

Plain-language notes on what changed since last month and what is worth checking next — not just raw numbers.

Daily Refresh & Status Page

Data refreshes automatically every day, with a status page showing every connection so nothing goes stale unnoticed.

Light & Dark Themes, Your Brand

The dashboard and report carry the client's own logo and brand colors, in either a light or dark theme.

How it works

From first call to a platform that runs.

01

Connect

Securely link the client's accounts with read-only access — nothing is ever write-enabled.

02

Build

Set up the dashboard and design the monthly report in the client's own brand.

03

Automate

Data refreshes on a schedule and the monthly report is ready to present, every month.

04

Improve

New analyses and slides get added as the business grows and reporting needs change.

Connects with

Google Analytics 4Google Search ConsoleGoogle AdsMeta Ads (Facebook & Instagram)ShopifyGoogle Merchant Center

Other platforms can be added on request.

Live demo

Don’t just read about it. Use it.

Open the working demo full-screen. It fits any device — desktop, tablet or phone — and runs on sample data only, so click anything.

Monthly report automation dashboard showing revenue, orders, ad spend and traffic by channel

FAQ

How long does setup take?+

It depends on how many platforms are connected and how the report is designed. After a short call about your accounts and brand, you get a clear timeline for your own setup.

Is my data safe?+

Access is read-only, and the data is stored on your own hosting — nothing is ever written back to your connected accounts.

Can the report use my branding?+

Yes — logo, colors and slide layout are all set up to match your brand.

Do I need to do anything each month?+

No. The data refreshes automatically and the report is ready to open whenever you need it.

Can you add more platforms or custom slides?+

Yes — additional platforms and custom analysis slides can be added on request.

“One trustworthy view of performance, ready every month — instead of hours rebuilding the same report by hand.”

Powered by Munavar Sahad — Digital Business Architect | eCommerce & Performance Marketing Specialist

Built with — Node.js application, MySQL database, secure read-only API connections, hosted on your own hosting.

Ready for a platform like this?

Let’s talk through how your business actually works — and what a platform built around it would do.

More platforms

Explore the catalog.